1 Fundamentals of Single Cell ATAC-seq (scATAC-seq) analysis
1.1 What are ATAC-seq and scATAC-seq?
ATAC-seq (Assay for Transposase-Accessible Chromatin with high-throughput sequencing) is a widely used, cost-effective method for genome-wide profiling of chromatin accessibility, utilizing the hyperactive Tn5 transposase for NGS library preparation.
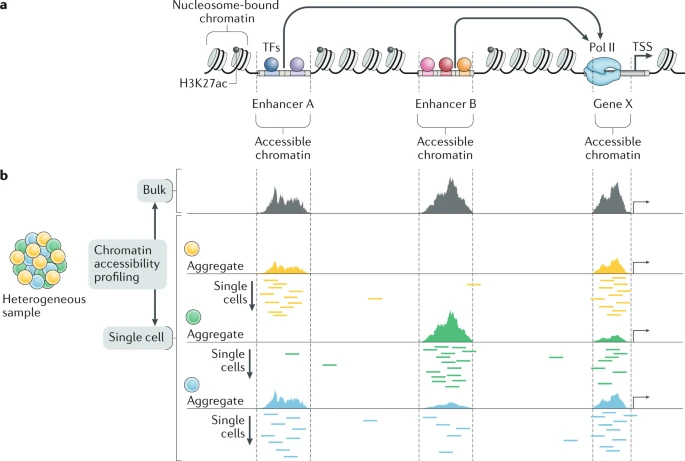
Single-cell ATAC-seq (scATAC-seq) extends this approach to single cells, enabling the study of chromatin accessibility in specific cell types within heterogeneous tissue samples.
1.2 What is Chromatin accesibility?
Chromatin accessibility refers to the degree of physical compaction of chromatin, a structure made up of DNA and proteins, primarily histones, transcription factors (TFs), chromatin-modifying enzymes, and remodeling complexes. While eukaryotic genomes are generally organized into nucleosomes (with ~147 bp of DNA wrapped around a histone octamer), nucleosome positioning varies across tissues and cell types. Regions like enhancers and promoters (cis-regulatory elements), which interact with transcriptional regulators, tend to be nucleosome-depleted, making the chromatin more accessible.
Genome-wide profiling of chromatin accessibility is a powerful method for identifying potential regulatory elements specific to cell types or states.
1.3 How does ATAC-Seq work?
ATAC-seq identifies open, accessible regions of chromatin across the genome. Here’s a step-by-step breakdown of how it works:
Cell/Nuclei Isolation: Cells or nuclei are isolated, ensuring the chromatin structure remains intact, along with DNA-binding proteins such as nucleosomes and transcription factors.
Tn5 Transposase Treatment: The chromatin is exposed to a hyperactive Tn5 transposase enzyme, which simultaneously cuts the DNA and inserts special sequences called adapters.
Adapter Insertion: These adapters (i5/P5 and i7/P7) are added at both ends of the DNA fragments. Only fragments that receive both adapters can be amplified in the next steps.
Library Amplification: The adapter-tagged fragments are amplified through PCR, creating a library of accessible chromatin regions.
High-Throughput Sequencing: The amplified fragments are sequenced using next-generation sequencing (NGS) technologies.
Data Analysis: Sequencing reads are mapped back to the genome. Regions with high concentrations of Tn5 activity (where many fragments originate) are identified as “peaks”, indicating open, accessible chromatin regions, which often correspond to regulatory elements such as enhancers and promoters.
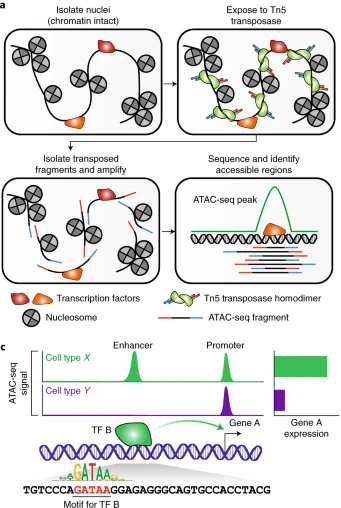
In a hypothetical ATAC-seq dataset, cell types X and Y both show peaks at the promoter of gene A, indicating shared accessibility. However, cell type X has an additional peak at an upstream enhancer, which drives higher gene A expression. This cell-type-specific peak is due to transcription factor B binding to the enhancer, a feature absent in cell type Y. ATAC-seq data also helps reveal transcription factor binding motifs, such as “GATAA” in this example, linked to differential accessibility.
ATAC-seq uses a hyperactive Tn5 transposase, engineered with three mutations to boost its activity. This enzyme simultaneously cuts and tags accessible chromatin regions, similar to how DNase I identifies DNase hypersensitive sites (DHSs). The tagged DNA fragments are then amplified and sequenced, offering a powerful method to map open chromatin.
1.4 Workflow
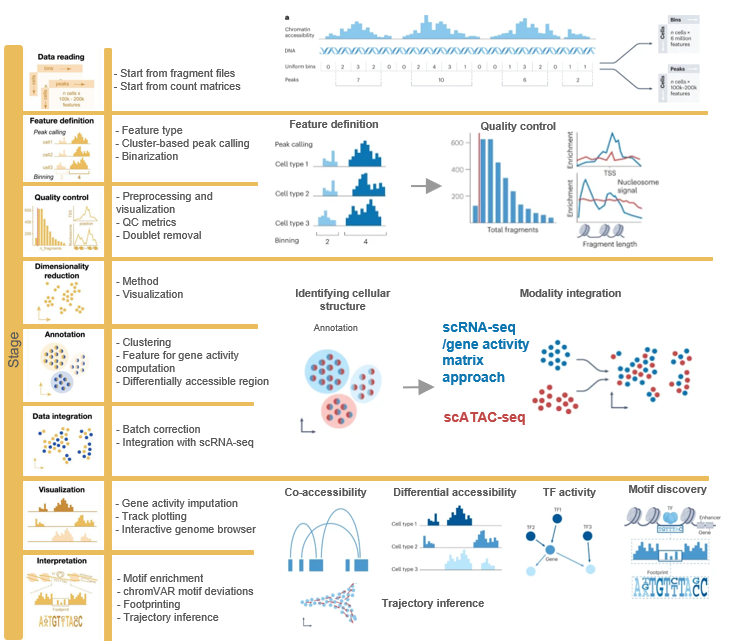
In the following sections, we will walk you through a standard workflow for analyzing scATAC-seq data. The accompanying summary figure outlines the different stages of the analysis and emphasizes the distinctions between commonly used frameworks. We’ll start by explaining the concepts of quality control and dimensionality reduction using R.
1.5 Data Structure
1.5.1 The ChromatinAssay Class
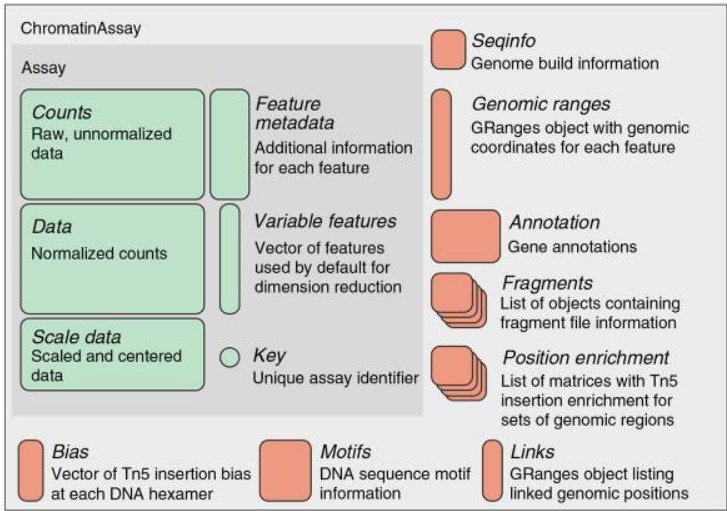
scATAC-seq data is stored in a ChromatinAssay object, which includes slots for additional information about motifs, gene annotations, and genome data. From this object, we create the main Seurat object for our analyses.
The ChromatinAssay class extends the standard Seurat Assay class and adds several additional slots for data useful for the analysis of single-cell chromatin datasets. The class includes all the slots present in a standard Seurat Assay, with the following additional slots:
ranges: AGRangesobject containing the genomic coordinates of each feature in thedatamatrix.motifs: AMotifobjectfragments: A list ofFragmentobjectsseqinfo: ASeqinfoobject containing information about the genome that the data was mapped toannotation: AGRangesobject containing gene annotationsbias: A vector containing Tn5 integration bias information (the frequency of Tn5 integration at different hexamers)positionEnrichment: A named list of matrices containing positional enrichment scores for Tn5 integration (for example, enrichment at the TSS or at different TF motifs)links: AGRangesobject describing linked genomic positions, such as co-accessible sites or enhancer-gene regulatory relationships.
We can use the granges() function on a Seurat object with an active ChromatinAssay experiment to view the chromosomal regions associated with each gene. For more details on the ChromatinAssay class, refer to the object interaction vignette and check this example.
1.5.2 The Fragment Class
The Fragment class is designed for storing and interacting with a fragment file commonly used for single-cell chromatin data. It contains the path to an indexed fragment file on disk, a MD5 hash for the fragment file and the fragment file index, and a vector of cell names contained in the fragment file. Importantly, this is a named vector where the elements of the vector are the cell names as they appear in the fragment file, and the name of each element is the cell name as it appears in the ChromatinAssay object storing the Fragment object. This allows a mapping of cell names on disk to cell names in R, and avoids the need to alter fragment files on disk. This path can also be a remote file accessible by http or ftp. For more details on the Fragment class.
| Column Number | Name | Description |
|---|---|---|
| 1 | chrom | Reference genome chromosome of fragment. |
| 2 | chromStart | Adjusted start position of fragment on chromosome. |
| 3 | chromEnd | Adjusted end position of fragment on chromosome. The end position is exclusive, so represents the position immediately following the fragment interval. |
| 4 | barcode | The 10x cell barcode of this fragment. This corresponds to the CB tag attached to the corresponding BAM file records for this fragment. |
| 5 | readSupport | The total number of read pairs associated with this fragment. This includes the read pair marked unique and all duplicate read pairs. |
Example:
  chrom  start    end            barcode readCount
1  chr1  10245  10302 AAAGATGAGGCTAAAT-1         1
2  chr1  55313  55699 AAACTCGTCTGGCACG-1         2
3  chr1  56455  56658 AAACTCGTCTGGCACG-1         1
4  chr1  60687  60726 AAACTGCAGTCTGTGT-1         1
5  chr1 235723 235936 AAACTGCTCCTATCCG-1         1
1.6 References
- Grandi, et al. 2022. Chromatin accessibility profiling by ATAC-seq. Nature protocols.
- Minnoye, et al. 2021. Chromatin accessibility profiling methods.Nature reviews methods primers.
- Heumos, et al. 2023. Best practices for single-cell analysis across modalities. Nature reviews genetics.
- Best practices. 23. Single-cell ATAC sequencing.
- Signac Tutorial. Calling peaks
- Seuratv4
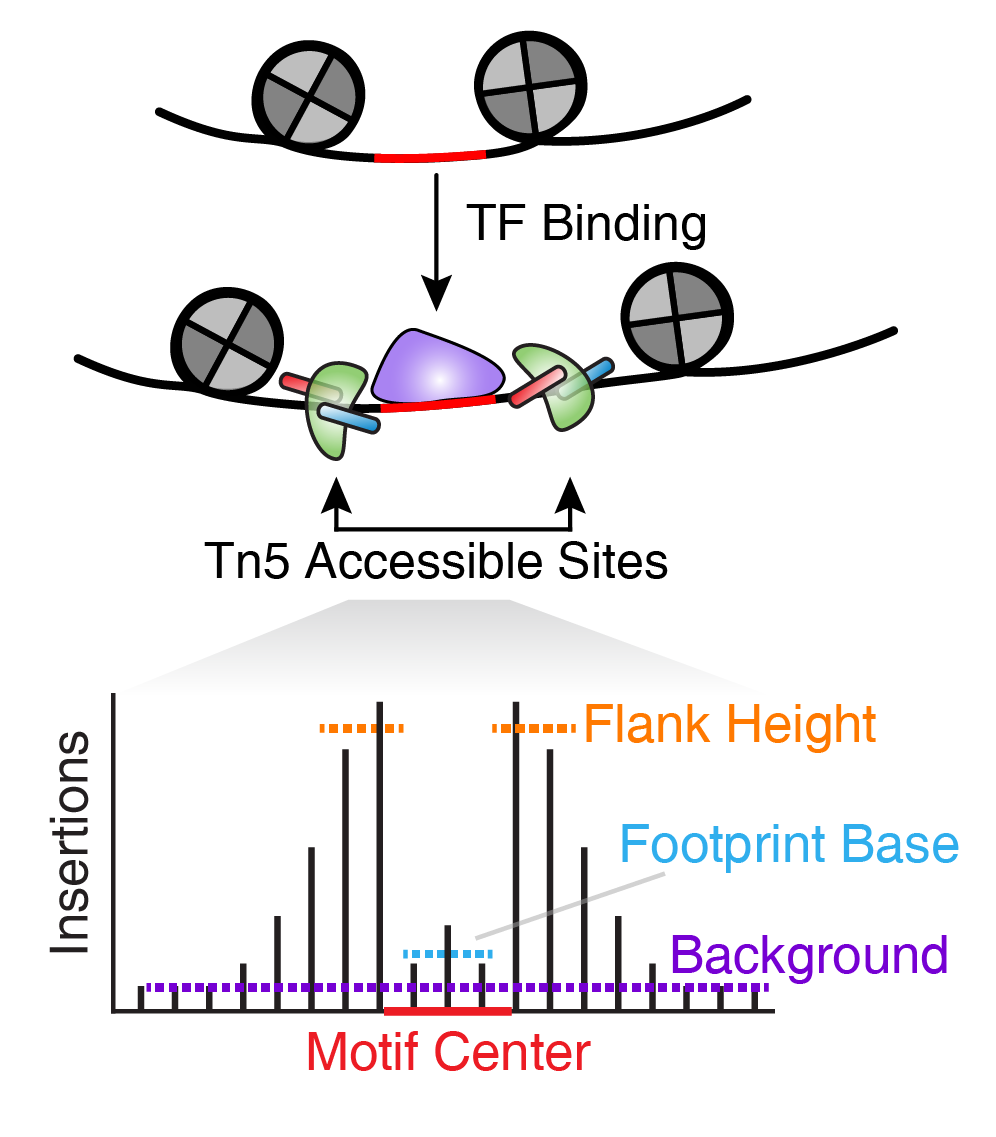
- ArchR tutorial. Chapter 14 Footprinting with ArchR
- Peak Calling using MACS2. Issue 560
- 10Xgenomics tutorial. Cell Ranger ATAC count: Feature-Barcode Matrices.