10 Practical 17: Exploring results (graphs)
10.1 The number of cells in each cell-type biases the null distributions and statistics of the Z-scores method
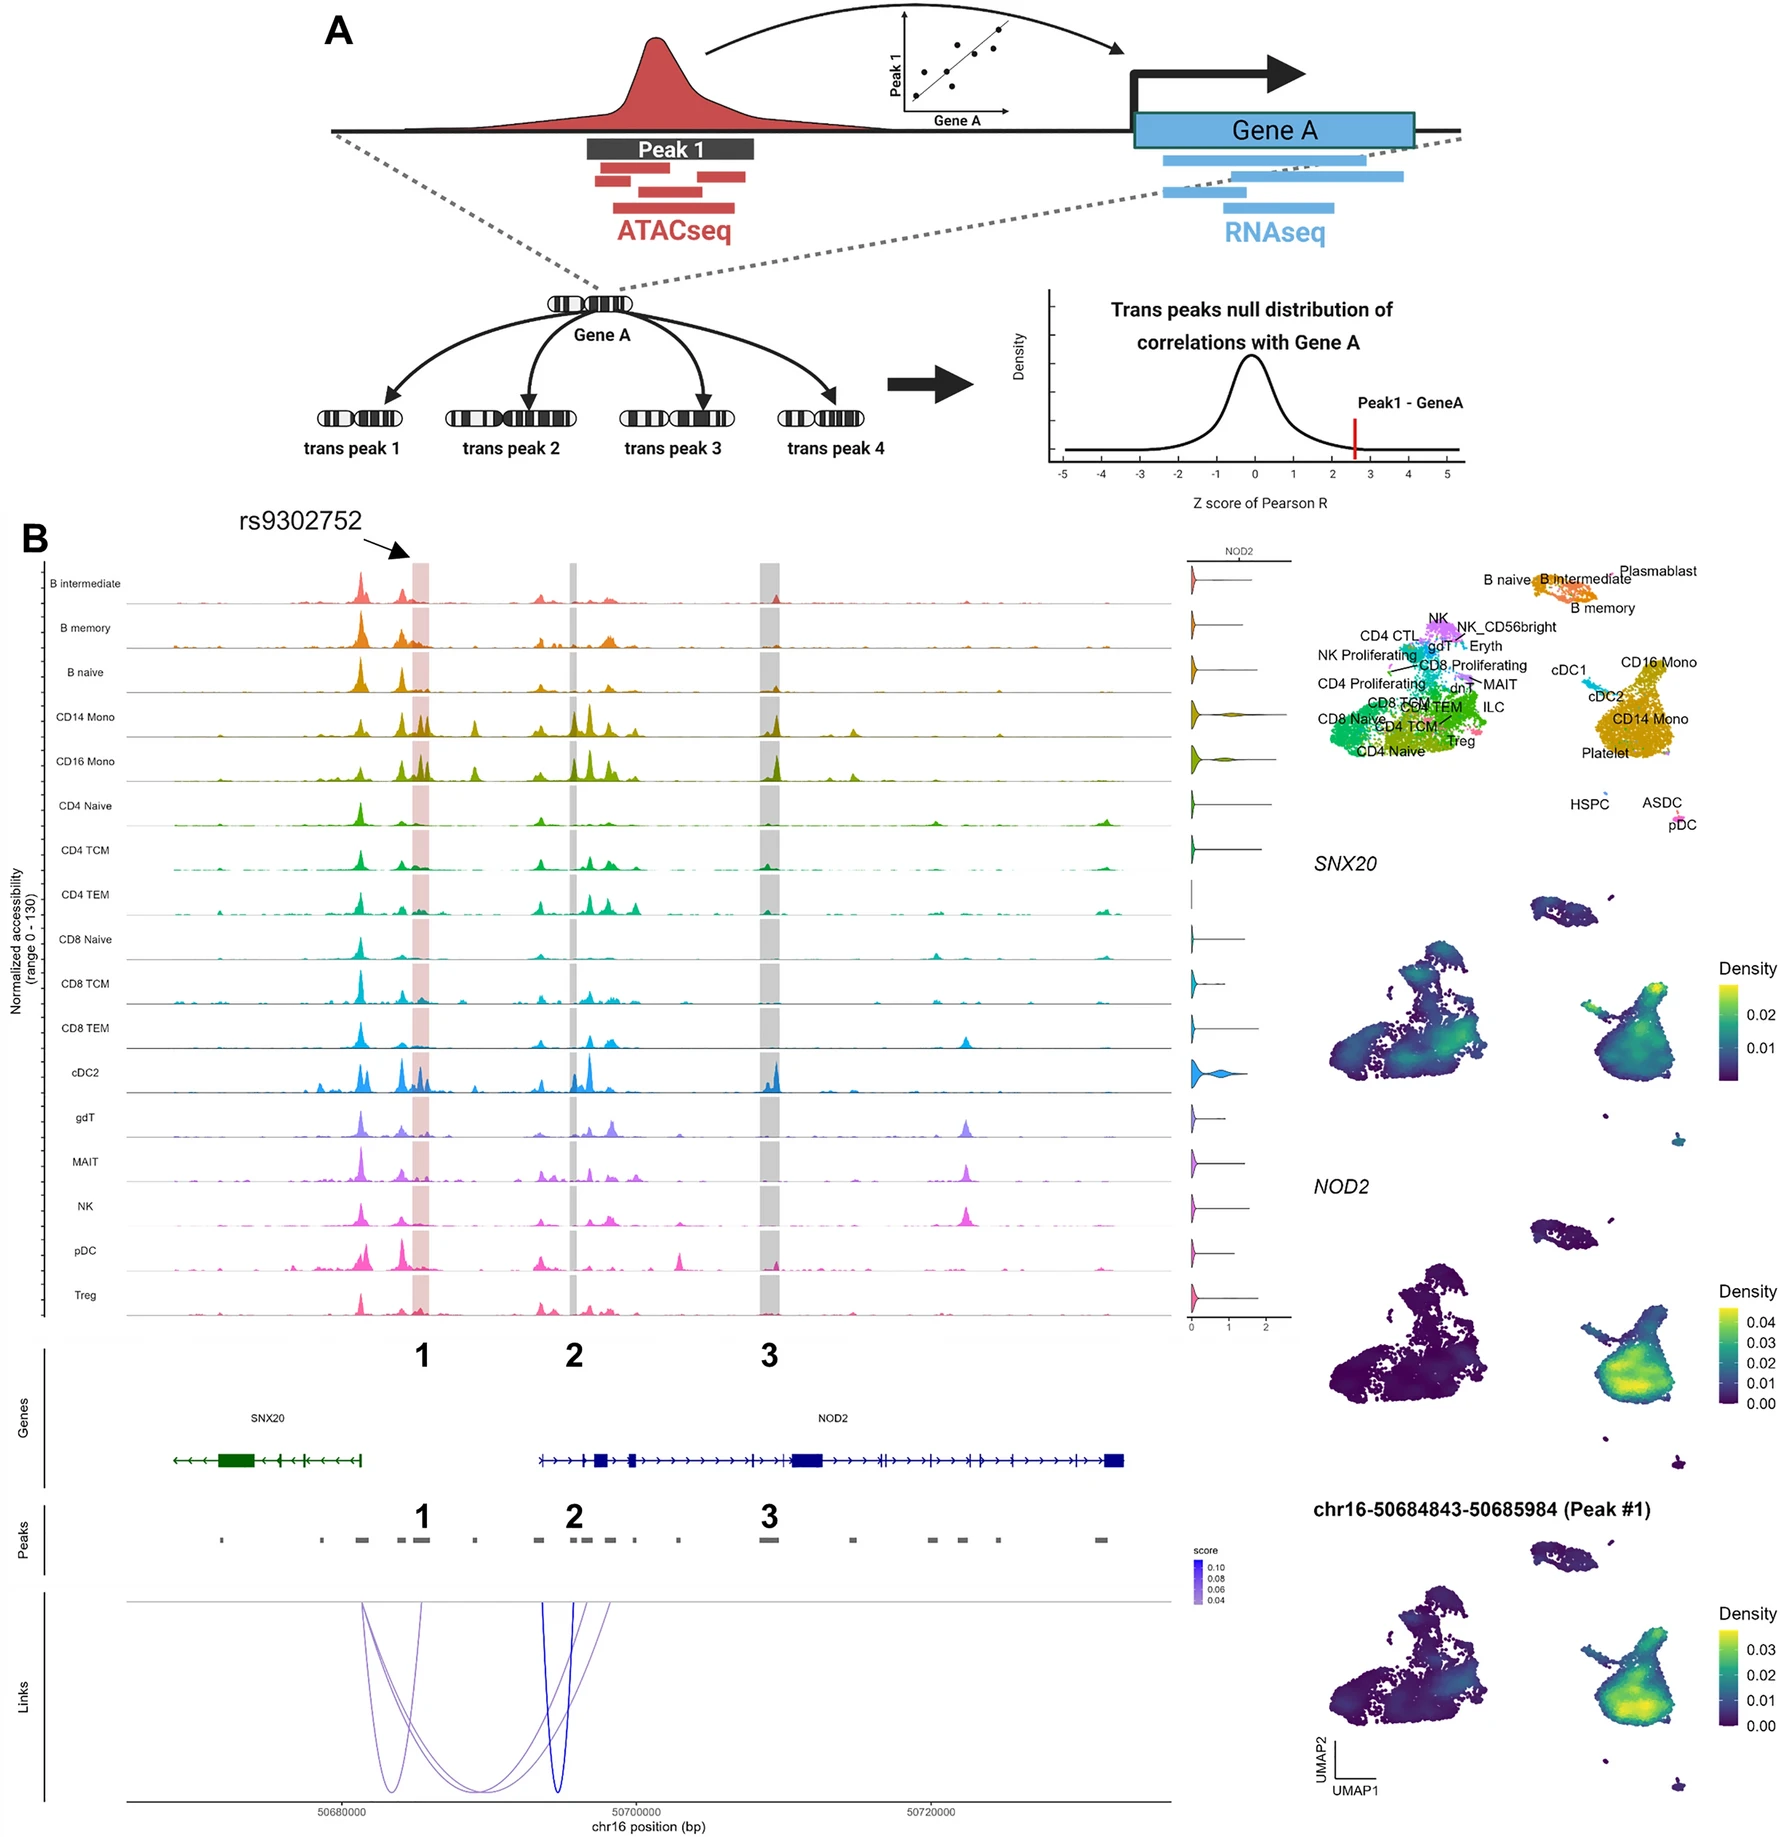
This study compares Z-scores, derived from the Pearson R value of cis-links between ATACseq peaks and nearby genes, to their matched trans-link null distribution. After analyzing PBMC multiomic data, significant differences were found between the Pearson R coefficients and Z-scores for many peak-gene links. An example is an ATACseq peak near the NOD2 gene, correlated with monocytes (R = 0.12), but showing no significant link using Z-scores (P = 0.07). However, a significant link was found with SNX20 (P = 0.02). Bimodal null distributions for trans-peaks at the NOD2 locus make Z-scores inaccurate. Excluding specific cell-type peaks leads to a unimodal distribution, highlighting the impact of peak selection on Z-scores.
10.2 Single cell lineage determination

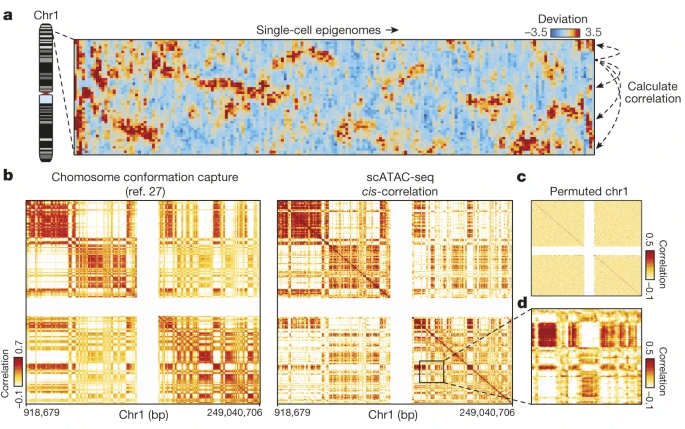
10.3 Single-cell chromatin accessibility reveals principles of regulatory variation
11 CITE-seq and scATAC-seq
To learn more about how the antibody barcode matrix is computationally generated from the sequencing data, please visit CITE-seq-Count. To learn more about CITE-seq and feature barcoding, please visit the CITE-seq site.
11.1 References
- Signac - tutorial Building trajectories with Monocle 3
- Signac - tutorial Visualization of genomic regions
- Leblanc & Lettre, et al. 2023. Major cell-types in multiomic single-nucleus datasets impact statistical modeling of links between regulatory sequences and target genes. Scientific reports
- Buenrostro, et al. 2015. Single-cell chromatin accessibility reveals principles of regulatory variation. Nature.
- Orr Ashenber, et al. Tutorial. Analysis of single cell RNA-seq data
- Der, et al. 2017.Single cell RNA sequencing to dissect the molecular heterogeneity in lupus nephritis JCI insight.
- CITE-seq and scATAC-seq tutorial.