1 Quick Recap: Introduction to scRNA‑seq + CITE-seq
1.1 scRNA-seq vs bulk-RNA-seq
-
Bulk RNA‑seq: measures average gene expression in a tissue; useful for detecting global changes, but it hides cellular heterogeneity.
- Insufficient for: early developmental studies or complex tissues such as the brain.
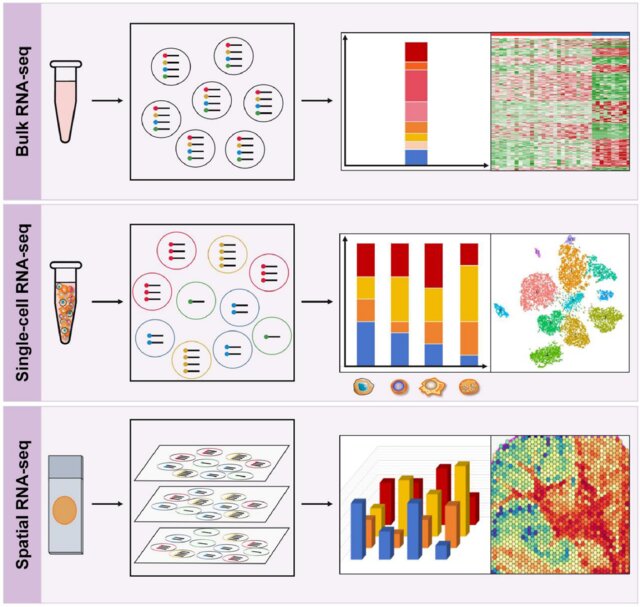
1.2 Single cell RNA-seq (scRNA-seq)
- First publication: 2009 (Tang et al, 2009)
- Popularity: 2014
- Estimate the distribution of gene expression levels across a cell population.
- Analysis at the single‑cell level.
- Reveals cell types, including rare populations.
- Analyze temporal dynamics and heterogeneity.
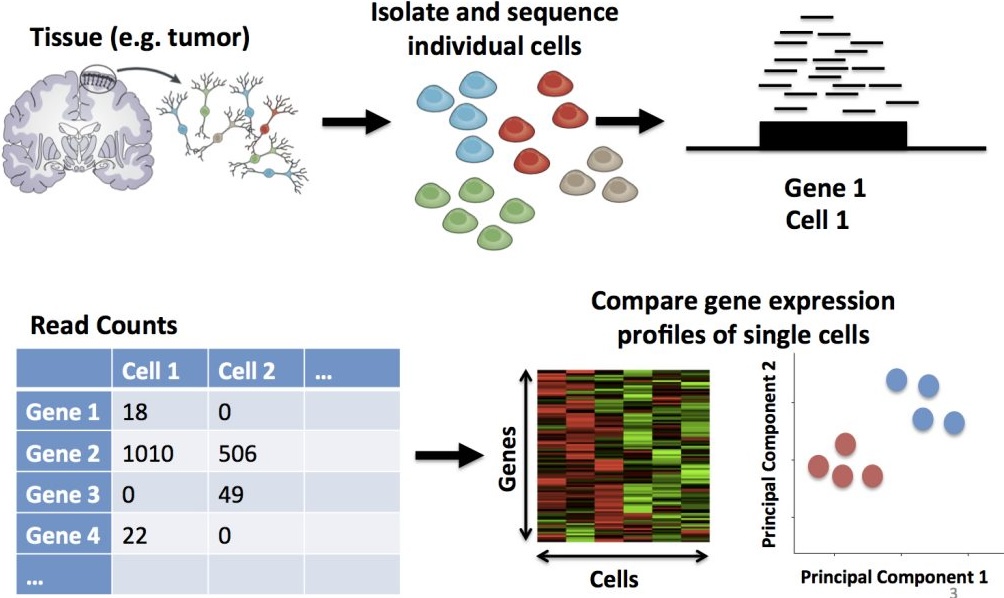
1.3 Heterogeneity: Internal diversity within a system or a set
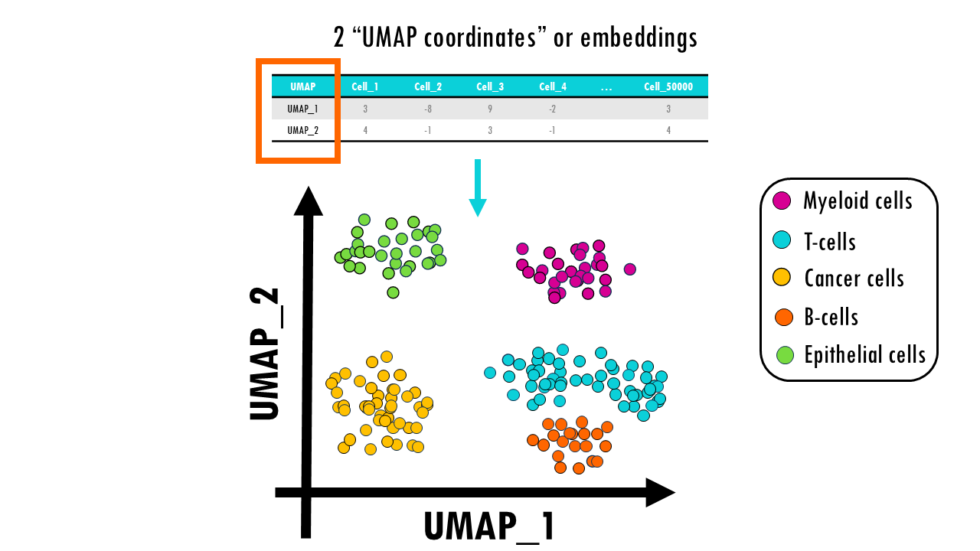
🔬 Not all cells are the same: even within the same tissue, there are differences in cell types, functional states, and gene expression levels.
🧬 Genetic and transcriptomic variability: each cell may express different genes or varying amounts of RNA, reflecting specific functions.
🩺 Relevance in disease: cellular heterogeneity explains why a tumor, for example, contains subpopulations with distinct behaviors (some more aggressive, others more sensitive to treatment).
Visualization through UMAP (Uniform Manifold Approximation and Projection):
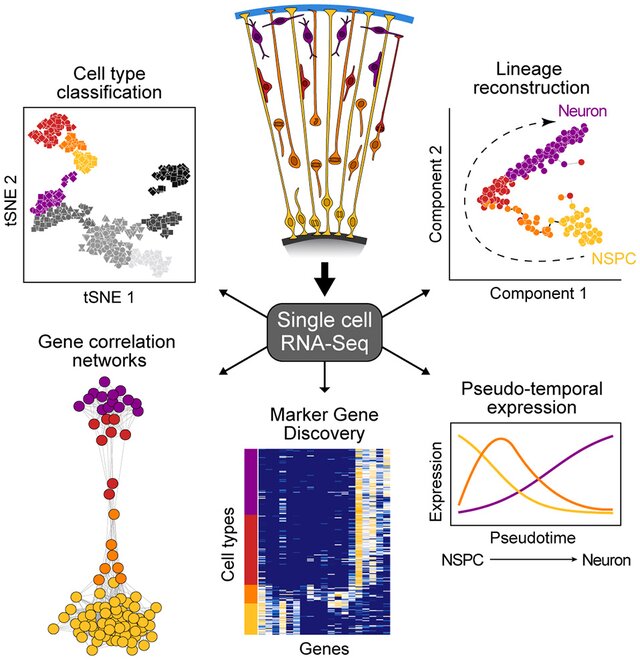
1.4 Questions scRNA‑seq can answer
- Discover new or rare cell types.
- Identify differential cellular composition between healthy vs. diseased samples.
- Understand cell differentiation in development and regeneration.
- Analyze plasticity and expression dynamics at the single‑cell level.
- Build cellular/genetic atlases → comprehensive catalog of cellular diversity.
- Applications in basic research and personalized medicine.
1.5 General Pipeline for scRNA‑seq with Seurat
| Step | Purpose | Seurat Command |
|---|---|---|
|
Load raw count matrix and create Seurat object |
Read10X(), CreateSeuratObject()
|
|
Filter cells/genes based on metrics (e.g., nFeature_RNA, percent.mt) |
subset(), PercentageFeatureSet()
|
|
Adjust counts for sequencing depth |
NormalizeData() or SCTransform()
|
|
Identify variable genes | FindVariableFeatures() |
|
Reduce dimensions for visualization |
ScaleData(), RunPCA(), RunUMAP(), RunTSNE()
|
|
Group cells and assign biological meaning |
FindNeighbors(), FindClusters(), FindAllMarkers()
|
|
Combine multiple datasets, remove batch effects |
FindIntegrationAnchors(), IntegrateData()
|
|
Specific goals: DEGs, trajectories, cell communication |
FindMarkers(), CellCycleScoring(), external packages |
1.6 Variations of scRNA‑seq
| Type of Analysis | Contribution |
|---|---|
| Unimodal (RNA only) | Cellular heterogeneity in gene expression |
| Multimodal (RNA + others, e.g., CITE‑seq) | Regulation, proteomics, and biological context |
| Trajectories | Temporal dynamics of biological processes |
| Cellular Interactions | Communication and functional networks |
| Dataset Integration | Comparison across conditions |
1.7 What is CITE-Seq?
CITE‑seq (Cellular Indexing of Transcriptomes and Epitopes by Sequencing) is a multimodal single‑cell technique that combines RNA sequencing with protein profiling at the level of individual cells.
1.7.1 📌 Key points about CITE‑seq
- Simultaneous measurements → captures both the transcriptome (scRNA‑seq) and surface proteins using antibody‑derived tags (ADTs).
- Highly multiplexed → allows detection of many protein markers in parallel, alongside unbiased RNA profiling.
- Single‑cell resolution → thousands of cells can be analyzed at once, integrating RNA and protein data.
- Multimodal context → CITE‑seq is part of the broader multimodal analysis frontier in single‑cell genomics, where multiple data types (RNA, ATAC, methylation, perturbations) are measured in the same cell.
- Applications → improves cell type identification, refines clustering, and reveals functional states that RNA alone might miss.
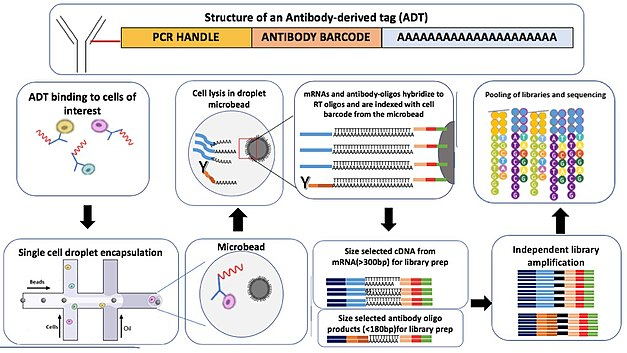
1.8 Overview
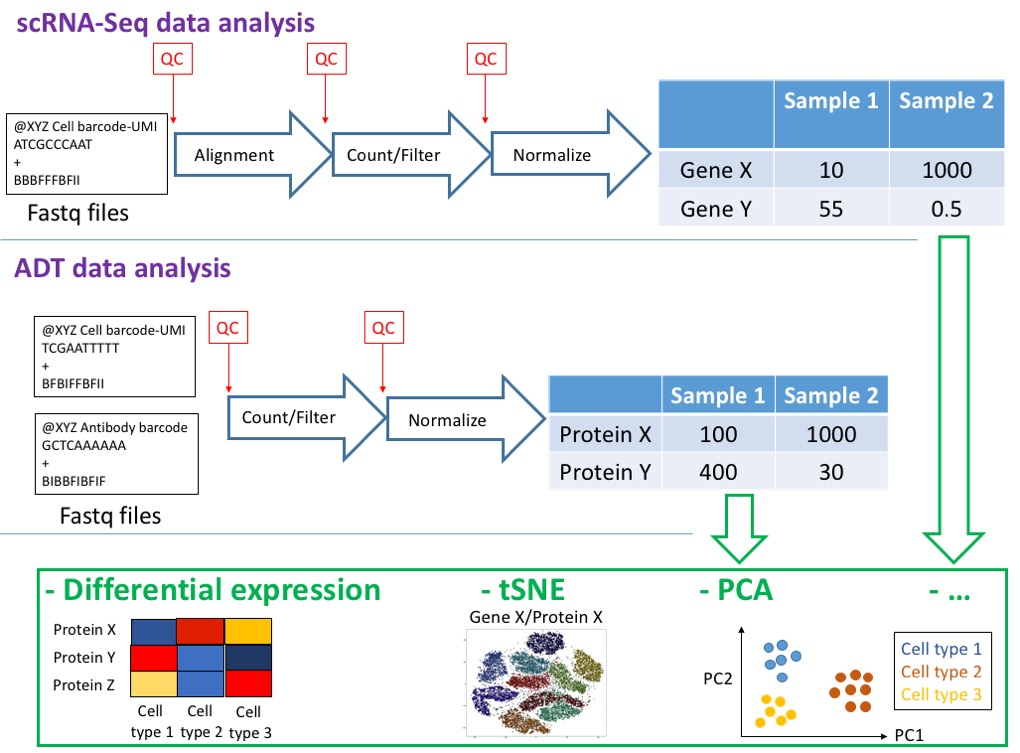
1.9 General Pipeline for CITE‑seq
| Step | Purpose | Seurat Command |
|---|---|---|
|
Load RNA counts and antibody‑derived tags (ADT) |
Read10X(), CreateSeuratObject()
|
|
Filter cells/genes based on RNA metrics and ADT counts |
PercentageFeatureSet(), subset()
|
|
Adjust RNA counts for sequencing depth |
SCTransform() or NormalizeData()
|
|
Center and scale protein counts |
NormalizeData(assay = "ADT"), ScaleData(assay = "ADT")
|
|
Identify variable genes | FindVariableFeatures() |
|
Reduce dimensions for RNA and ADT separately |
RunPCA(assay = "RNA"), RunPCA(assay = "ADT")
|
|
Combine RNA + ADT signals |
FindMultiModalNeighbors(), RunUMAP(nn.name = "weighted.nn")
|
|
Group cells and assign biological meaning |
FindClusters(), FindAllMarkers()
|
|
Discover enriched proteins per cluster, refine cell types |
FindMarkers(assay = "ADT"), external multimodal workflows |
1.10 scRNA-seq vs scRNA-seq + CITE‑seq
| Approach | Type | Purpose |
|---|---|---|
| scRNA‑seq | Unimodal (RNA only) | Characterize transcriptomic heterogeneity: identify cell types, states, and gene expression dynamics based solely on RNA. |
| CITE‑seq | Multimodal (RNA + proteins) | Integrate RNA + surface proteins: refine cell type annotation, validate clusters, and capture functional context beyond transcriptomics. |
1.11 References
- Cite-seq-Count
- CITE-Seq tutorial
- End-to-end CITE-seq analysis workflow using dsb for ADT normalization and Seurat for multimodal clustering
- Using Seurat with multimodal data
- Simultaneous epitope and transcriptome measurement in single cells
- Introducción a scRNA-seq y control de calidad
- Workshop de scRNA-seq